info@tutelaprep.com
 +91 88263 45541
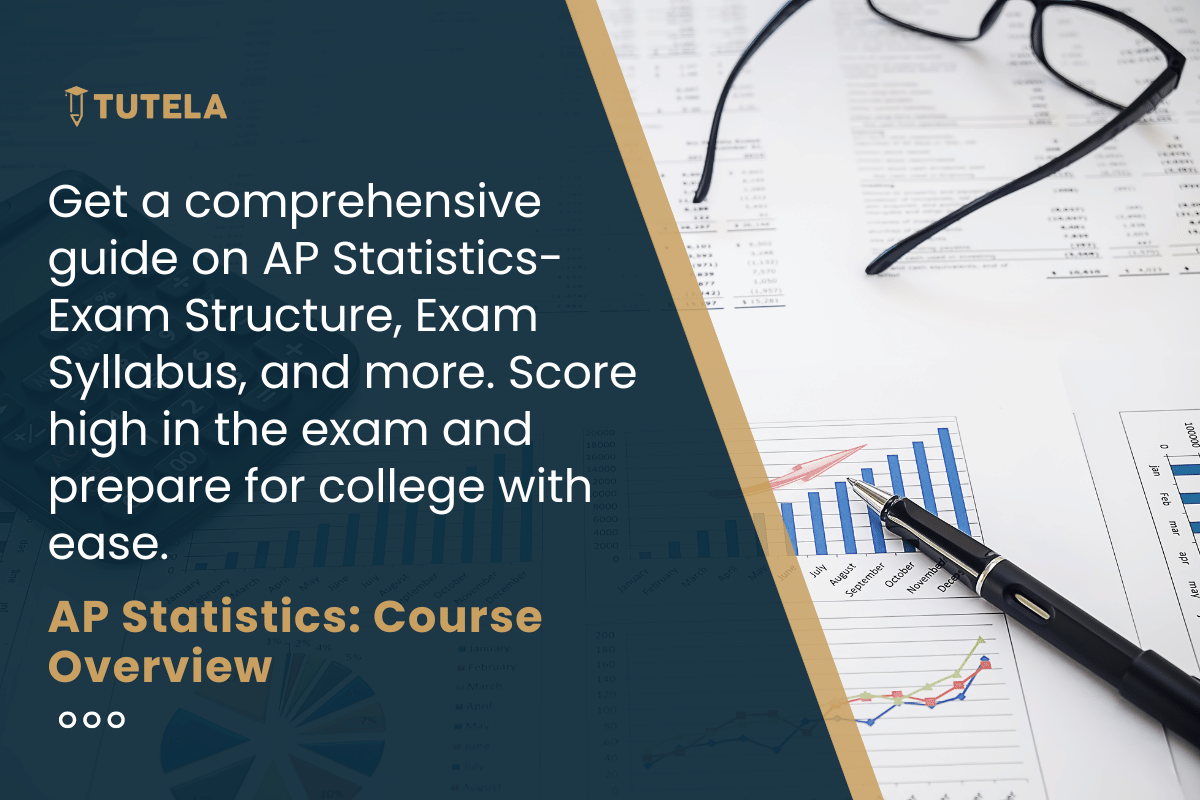
In the dynamic landscape of education, the Advanced Placement (AP) Statistics course stands as a gateway to understanding the world through a statistical lens. Tailored for high school students, this course offers a comprehensive exploration of key statistical concepts, equipping learners with the analytical tools essential for decision-making, problem-solving, and critical thinking. If you want to know about AP Classes, refer here for Gurgaon and Mumbai.
AP Statistics in Brief
The AP Statistics course is divided into several modules, each delving into fundamental aspects of statistical reasoning. Topics include data analysis, experimental design, probability, and inference. The curriculum is designed to strike a balance between theoretical understanding and practical application, ensuring that students not only grasp statistical principles but also know how to wield them effectively in real-world scenarios. The AP Statistics Exam is on Thursday, May 7, 2026.
Importance of AP Statistics
The importance of AP Statistics is stated below:
- College Credit: Many colleges and universities in the United States offer course credit or advanced standing to students who perform well on the AP Statistics exam. This can allow students to skip introductory-level statistics courses in college, saving both time and money.
- Skill Development: The AP Statistics exam focuses on developing statistical reasoning, interpretation, and communication skills. These skills are valuable not only in college but also in various professions where data analysis and interpretation are crucial.
- Quantitative Literacy: In an increasingly data-driven world, the ability to understand and interpret statistics is essential. AP Statistics helps students become statistically literate citizens who can critically evaluate and make informed decisions based on data.
- Rigorous Assessment: The AP Statistics exam is a comprehensive and challenging assessment that covers a wide range of statistical topics. Successfully navigating this exam demonstrates a high level of mastery in the subject.
Syllabus of AP Statistics
| Unit Name | Topics | Weightage in the Exam |
| Unit-1: Exploring One-Variable Data |
| 15-23% |
| Unit-2: Exploring Two-Variable Data |
| 5-7% |
| Unit-3: Collecting Data |
| 12-15% |
| Unit-4: Probability, Random Variables, and Probability Distributions |
| 10-20% |
| Unit-5: Sampling Distributions |
| 7-12% |
| Unit-6: Inference for Categorical Data: Proportions |
| 12-15% |
| Unit-7: Inference for Quantitative Data: Means |
| 10-18% |
| Unit-8: Inference for Categorical Data: Chi-Square |
| 2-5% |
| Unit-9: Inference for Quantitative Data: Slopes |
| 2-5% |
AP Statistics Exam Structure
| Section | No. of questions | Duration | Weightage | Details |
| Section I: Multiple Choice | 40 Questions | 1 hour 30 minutes | 50% | Individual questions or sets of questions based on a shared prompt. |
| Section II: Free Response | 6 Questions | 1 hour 30 minutes | 50% | Part A: 5 questions focused on data collection, probability, inference, and skill combinations. |
| Part B: 1 investigative task involving multiple skills and non-routine applications. |
Top 10 Majors Backed up by AP Statistics
1. Statistics/Data Science: AP Statistics provides a strong foundation for those interested in pursuing a major or career in statistics or data science.
2. Economics: Understanding statistical methods is crucial in economic research and analysis, making AP Statistics beneficial for economics majors.
3. Psychology: Psychological research often involves statistical analysis of data, making AP Statistics relevant for psychology majors.
4. Biology/Bioinformatics: Students pursuing majors in biology or bioinformatics may find AP Statistics useful for analyzing biological data and conducting experiments.
5. Sociology: Sociological research often involves statistical techniques to analyze and interpret social patterns, making AP Statistics beneficial for sociology majors.
6. Political Science: Political scientists often use statistical methods to analyze survey data and draw conclusions, making AP Statistics valuable in this field.
7. Business/Finance: AP Statistics can be beneficial for majors in business and finance, where data analysis plays a crucial role in decision-making and market research.
8. Public Health: Understanding statistics is essential in public health for analyzing health-related data, conducting epidemiological studies, and making informed policy decisions.
9. Environmental Science: AP Statistics can be valuable for majors in environmental science, aiding in the analysis of environmental data and the interpretation of research findings.
10. Computer Science: In computer science, particularly in areas like machine learning and artificial intelligence, a strong statistical background is advantageous. AP Statistics can provide a solid foundation for understanding algorithms and data analysis techniques.
TutelaPrep’s College Navigator allows students to search for colleges based on their preferred country and course. Not only that, it also provides valuable insights into each college’s specific admission requirements for those exams. Through College Navigator, you can even connect with alumni at your chosen colleges to get a firsthand feel for campus life and academics.
We hope this article helped you with the subject knowledge. Reach out to us by filling out our assistance form if you need any help with the preparations.